
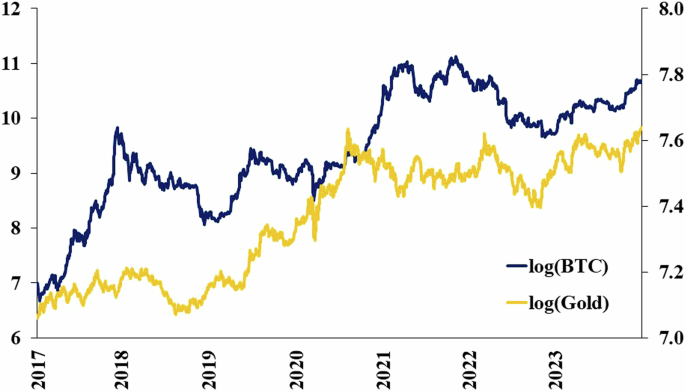
Table 6 shows how the returns of stock market indices and Bitcoin are correlated, and how these correlations change in response to market shocks. This information helps identify the nature of Bitcoin as an asset. For example, if Bitcoin has a negative correlation with the stock market during downturns, it acts as a safe haven asset. On the other hand, a positive correlation and high volatility indicate that Bitcoin is more speculative.
The analysis will begin by identifying general patterns in the correlation between Bitcoin and stock markets. We will focus on both the direction of these correlations and their sensitivity to market shocks, meaning how much the correlations change. A high sensitivity, around 3%, suggests that Bitcoin is significantly influenced by that specific stock market. In contrast, a low sensitivity, 1% or less, indicates that Bitcoin may serve as a hedge or safe haven asset (Ekstrand and Musial, 2022).
Observations reveal that none of the stock market indices demonstrated significant correlations with Bitcoin prior to the pandemic. During the COVID-19 period, significant dynamic conditional correlations emerged between Bitcoin and stock market indices in Thailand (THA), Taiwan (TWN), Japan (JPN), the United States (USA), Canada (CAN), Brazil (BRA), the United Kingdom (GBR), Germany (DEU), Switzerland (CHE), France (FRA), and Italy (ITA). In contrast, Thailand (THA), Taiwan (TWN), and Japan (JPN) stock market indices showed weaker correlations with Bitcoin relative to their American and European counterparts with less than 1% of sensitivity. Hence, the hedge or safe haven potential appears to be substantial for these stock markets.
Following the commencement of monetary policy normalization on March 17, 2022, after the Federal Open Market Committee (FOMC) approved an initial 0.25% interest rate hike, significant conditional correlations continued across most indices. However, this trend did not extend to Singapore (SGP), Malaysia (MYS), the United States (USA), and Canada (CAN). It is notable that the relationships between Bitcoin and stock market indices in advanced markets (America and Europe) have weakened compared to the COVID-19 period.
The outputs from the DCC-GARCH models are presented in Tables 7–10. Upon examining the results, we observe that l1 + l2 is less than 1 in every model, indicating that the DCCs are stationary and mean-reverting. Regarding Bitcoin, the value of l1 is low and insignificant, particularly during the pre-COVID-19, suggesting low sensitivity in the correlation to shocks. In contrast, all values of l2 are high and significant at the 1% level, indicating that the correlations are highly persistent (Ellul, 2015). Overall, this suggests that Bitcoin returns are independent of other stock market indices. However, during the COVID-19 period, both l1 and l2 are significant across all markets, indicating sensitivity in the correlation to shocks and high persistence in the correlations.
Tables 7 and 8 display the estimation results from DCC-GARCH models between Bitcoin and stock markets in ASEAN and Asia, respectively. ARCH parameters are significant for all stock market indices throughout all periods. However, the coefficient for Singapore’s stock market index during the monetary policy normalization period is negative and statistically insignificant. Additionally, there is weak evidence of volatility spillover in all stocks before the COVID-19 outbreak in 2019 and during monetary policy normalization period, suggesting that stock market volatility is influenced by its own past values during these times. Despite this, the GARCH parameters are significant across markets, demonstrating that the previous returns significantly affect present conditional volatility. This finding suggests that, during this phase, ASEAN market equity indices have replaced Bitcoin as a hedge. On the other hand, the estimated coefficients l1 and l2 for Asia stock market indices demonstrate a statistical significance in relation to all stock market indices’ returns across all three periods. Based on empirical evidence, Bitcoin does not act as a hedge alternative for Asia’s stock indices examined.
Tables 9–10 display the results of Bitcoin return and volatility on stock markets in America and Europe. ARCH parameters are significant for Bitcoin as well as for all stock market indices across all periods, indicating that past volatilities of American and European stocks influence their current volatility. Similarly, the GARCH (1,1) model parameters are significant across all markets, demonstrating a robust correlation between conditional volatility and its past values. In the context of DCC models, the estimated coefficients l1 and l2 are statistically significant across all stocks of all periods, implying Bitcoin’s limited effectiveness as a hedge.
The parameters l1 and l2 are also used to perform the Wald test, which aims to verify whether the conditional correlations are dynamic rather than constant. If the null hypothesis of H0: l1 = l2 = 0 cannot be rejected, the DCC model simplifies to a CCC model. The test results confirmed that a CCC model is too limited to describe the relationships between the assets in most cases. However, there was one exception where the null hypothesis could not be rejected. The model comparing Bitcoin to ASEAN stock indices during the increased interest rate period.
Moreover, the Wald test and information criteria were applied to confirm that the DCC model outperformed the CCC model. Table 11 presents the p-values of the Wald test and the values of AIC and BIC for the models in each panel. The results indicate that the Wald test rejects the null hypothesis of equivalence between the two models, indicating a preference for the DCC model. This preference arises because the assumption of time-invariant conditional correlation in the CCC–GARCH model is too restrictive for these data. The AIC and BIC values also support this conclusion, as they are consistently more negative for the DCC models. Finally, the results from the Ljung-Box tests indicate no remaining autocorrelations in the residuals of the return series at the 5% significance level, confirming that the models are correctly specified.
In addition to Bitcoin, robustness checks were tested on gold to compare with Bitcoin. The dynamic conditional correlations between the returns of stock market indices and gold are presented in Table 12. The negative signs are observed for Singapore (SGP), Vietnam (VNM), Japan (JPN), the United States (USA), Canada (CAN), the United Kingdom (GBR), Germany (DEU), Switzerland (CHE), France (FRA), and Italy (ITA) during the pre-COVID-19, with significant level of 1%. This reveals that an increase in gold returns results in a simultaneous decrease in stock market returns, which suggests that gold may be effective as a hedge or safe haven (Ratner, 2013). Although negative values can also be seen for Malaysia (MYS), China (CHN), Taiwan (TWN), Hong Kong (HKG), and South Korea (KOR), the relationships are not significant. During the COVID-19 outbreak, gold was positively correlated with almost stock markets except ASEAN stock markets, but significant dynamic correlation of ASEAN stock market and gold emerged after the Federal Open Market Committee (FOMC) approved an initial 0.25% interest rate hike. Moreover, during U.S. monetary policy normalization, gold experienced a decrease in correlation with Asia and Europe stock indices and insignificant correlation with America stock indices.
Tables 13–16 present the estimation results from DCC-GARCH models comparing gold and stock markets. The ARCH parameters are significant for gold and all stock market indices across all periods, indicating that past shocks influence current market volatility. The GARCH parameters are also significant, showing that conditional volatility is strongly correlated with its past values. However, the coefficients l1 and l2 for ASEAN stock market indices are statistically insignificant in relation to all stock market indices’ returns, particularly before COVID-19 and during the U.S. monetary policy normalization period. This suggests that these equity indices have replaced gold as a safe haven asset. Additionally, Table 17 shows the p-values of the Wald test and the AIC and BIC values for the models in each panel. The Wald test results reject the null hypothesis of equivalence between the two models, indicating a preference for the DCC model.
In summary, gold clearly displayed a safe haven property before the COVID-19 pandemic, which such properties are not displayed for Bitcoin. This empirical finding is consistent with Sinlapates et al. (2023). During COVID-19, gold and Bitcoin could provide hedge property for indices in Asia, America, and Europe stock markets, but gold had more robustness. The result is partially consistent with Shehzad et al. (2021). Lastly, gold have become a safe haven potential for ASEAN stock market since U.S. initial 0.25% interest rate hike.